Make outcomes tracking a breeze.
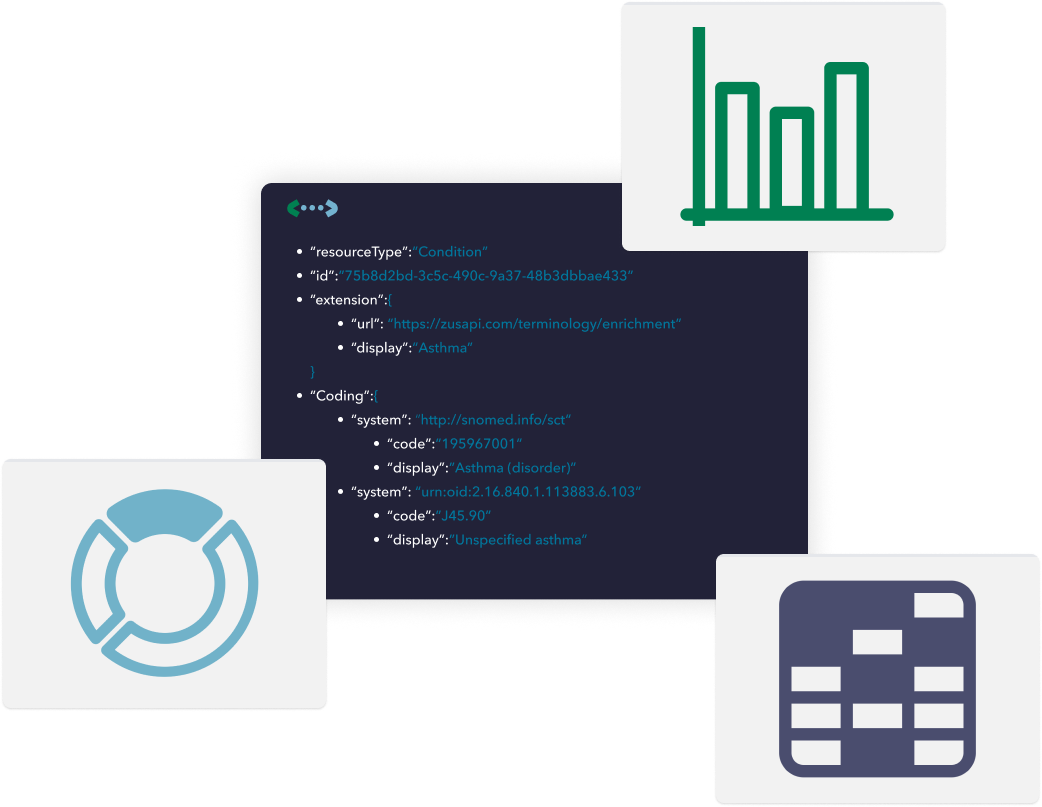
Patient data is infinitely more usable when you can plug it into your database for analytics – but with FHIR’s nested structure, this often isn’t possible. That’s why Zus has created a process we call rectangularization: we take JSON data and export it to tables for easy analysis.
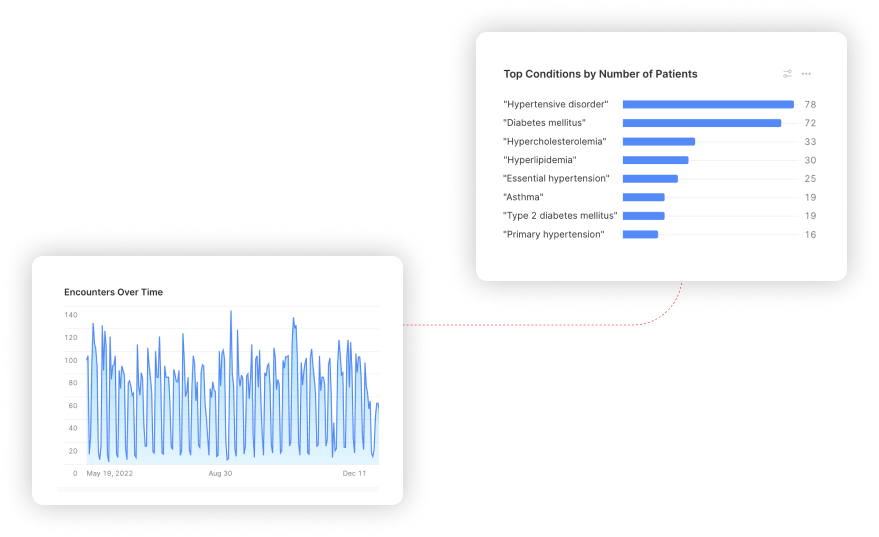
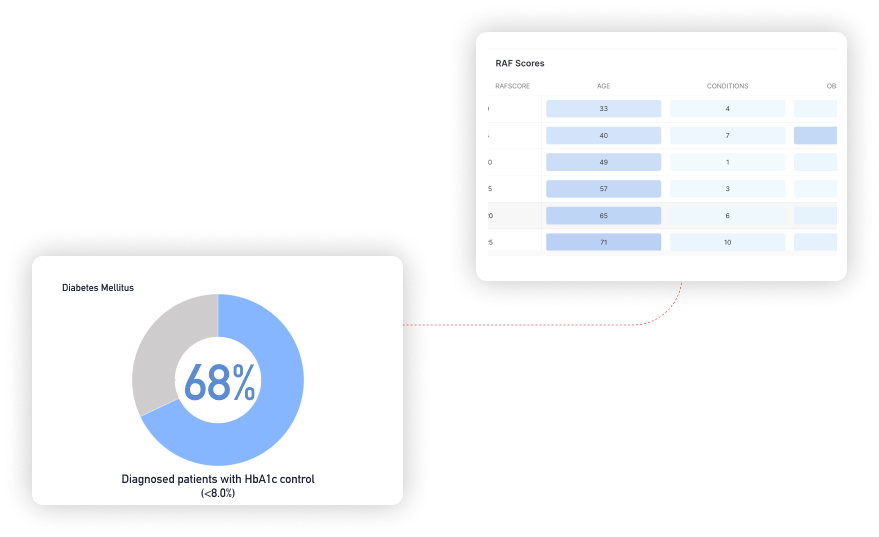
With the Zus Data Mart, you can start measuring health outcomes and quality metrics in no time, either via our standard Snowflake offering or in your own data visualization solution.


Claims are great for gathering high-level information, but it doesn't tell you what actually happened during that 99-204. If you had 10-15 diagnoses on a current event, you may only get 8-10 of those. The raw clinical data that Zus provides helps us get a full picture of the patient as close to that encounter as possible.
We can log into our payer partner's portal, but it's a manual search. We had teams trying to build a real-time actionable list into a notification, but the best they had was outdated data. Having Zus data from the last 5 days is actionable and incredibly helpful.