
What’s in a README? That which we call the [first go-to piece of developer onboarding material to a repo] by any other [filename] would smell as sweet.
As a project or codebase evolves, team members will leave and new ones will join. For the latter events it’s critical to have a concise README in the base of any project to introduce and explain a project with minimal hand-holding. With software or infrastructure (cough, Cloud) that can also mean how it’s meant to run, where it’s supposed to reside, and what it actually builds or deploys. Diagrams are an excellent supplement to a README, and defining that diagram with code makes it developer friendly, maintainable, and durable (vs. a fragile or overly verbose auto-generation).
With more complex projects or (especially) infrastructure-as-code, diagrams are essential to illustrate the network topology or module relations. The diagram code’s syntax is meant to be the focus for documentation, and relieves a developer from trying to visually align boxes or figure out how to spline an arrow to be aesthetically pleasing. (A diagram rendering might not be pretty but it’s correct to the code and therefore no team member should ever be harangued about poor artistic skills.) The diagram code can always be referenced for more detail, and can even include non-rendering elements such as comments.
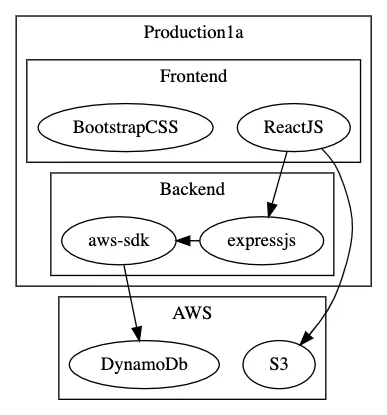
Making the Diagram Happen — An Example
The examples below are written in Graphviz’s directed graph, digraph, DOT language. (The Graphviz technology has stood the test of time, originating from the early 1990’s out of AT&T Labs Research, and is still widely used.) The diagram’s image has been rendered with the `dot` program, and the caption has a link to a webapp which can do browser side rendering.
Keep it Simple, Automation Can Be Overkill
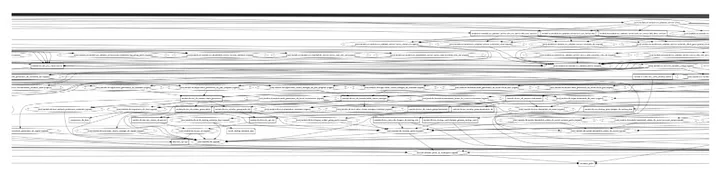
It’s a very basic diagram and that’s part of the thesis here: KISS applies even to documentation. Your product or business team members might even start looking inside your repo because the diagram has lowered the learning curve just that bit extra. As an onboarding engineer it’s quicker to view an image than to try to read/parse through hundreds of lines of terraform. It is worth mentioning that terraform can generate graphviz code
terraform graph | dot -Tpng -o output.png
but I’ve tried this with even medium sized projects and the resulting image is >40k pixels wide and not useful.
For the Long Run
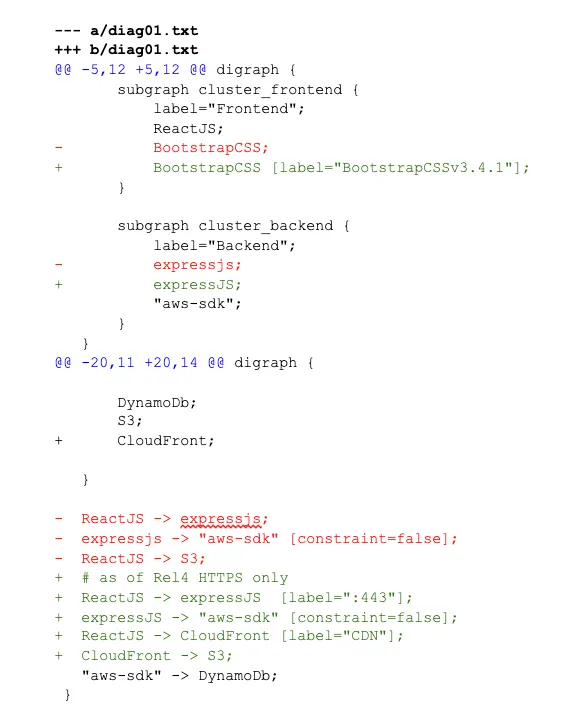
Beyond the code+rendering process, there’s immense benefit in the re-use of the usual mechanics of git/GitHub to the diagram code: git add, commit, diff, compare, merge, pull request, blame, etc. As fluently as your team of developers and engineers can collaborate over application code in a repository, the same mode can apply to maintaining the project’s diagram. And in the long run, a complex project’s repository has a better chance of having a maintained and up-to-date diagram.

Be the Agent of Change
How best to adopt? I would highly recommend experimenting with the Graphviz dot language and asking your team to do the same. If your repository is public then Gravizo has a clever way of scanning your repository and providing a link to a rendered image. But if your code is secure and private, the Graphviz CLI (dot) can easily be downloaded and then it becomes a (fun) exercise in CI to update your diagram after a PR/merge of your README and diagram code:
$ dot yourDiagramCode.dot -Tpng -o output.png #then to s3/etc.
Happy diagramming.
“I’ve always been fascinated by maps and cartography. A map tells you where you’ve been, where you are, and where you’re going — in a sense it’s three tenses in one.”
— Peter Greenaway